Rethinking Visual Planning with the Four Circles Schedule Process Chart
In a world saturated with data, the ability to present information clearly and memorably has become a competitive advantage. Professionals across industries are moving away from dense spreadsheets and text-heavy slides toward visual frameworks that communicate at a glance. The Four Circles Schedule Process Chart has emerged as a quietly powerful tool in this shift—offering a structured yet flexible way to map time, track progress, and design compelling narratives around business processes.
What makes this particular chart resonate is its blend of simplicity and depth. On the surface, four interconnected circles arranged around a central timeline or process flow may seem minimal. But that minimalism is precisely where its strength lies. It strips away noise, forces clarity, and creates a visual rhythm that audiences can follow without cognitive overload. Whether you are building a quarterly roadmap, illustrating a product development cycle, or designing an investor presentation, the Four Circles Schedule Process Chart adapts to the story you need to tell.
Understanding the Core Structure
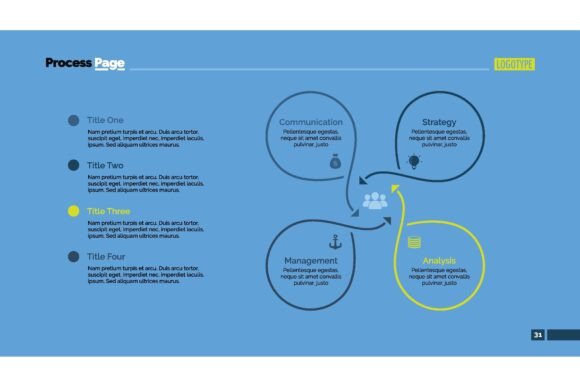
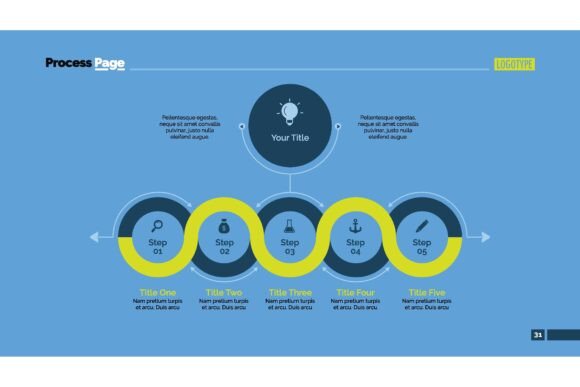
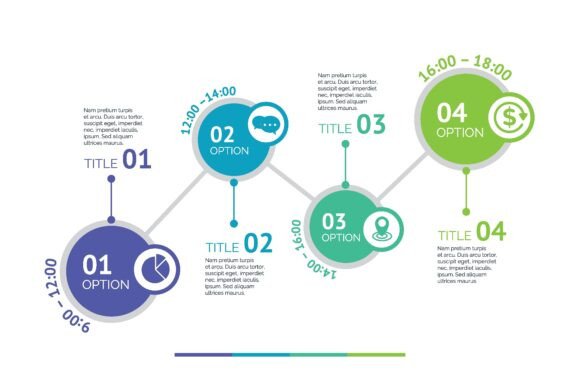
At its heart, the Four Circles Schedule Process Chart consists of four circular graphic elements arranged in relationship to one another—often along a horizontal or circular flow that represents a schedule, sequence, or process. Each circle typically houses a distinct phase, milestone, or data point. Connecting lines, arrows, or overlapping regions illustrate relationships, dependencies, or transitions between stages.
This is not merely decorative. The circular form carries psychological weight. Circles suggest completeness, continuity, and cyclical thinking—qualities that resonate deeply when discussing time management, iterative processes, or life-cycle planning. By constraining information into four primary visual anchors, the chart imposes a discipline that prevents overcomplication. It asks the creator to identify what truly matters and present it with clarity.
Common applications include:
- Quarterly business reviews — mapping four strategic objectives across a fiscal period
- Project timelines — breaking a delivery schedule into four sequential phases
- Product life-cycle diagrams — illustrating conception, development, launch, and maturity
- Event planning schedules — coordinating four major workstreams leading to a milestone date
- Training and onboarding roadmaps — structuring progressive learning stages
Why Visual Simplicity Is Gaining Ground in Business Communication
The growing attention around tools like the Four Circles Schedule Process Chart does not exist in isolation. It reflects a broader transformation in how professionals consume and process information. Research consistently shows that visual information is retained significantly longer than text alone. In an era of constant notifications, compressed attention spans, and remote collaboration, the demand for digestible visual formats has never been higher.
Companies are investing in internal design literacy. Marketers are expected to think like information designers. Consultants and strategists are judged as much by how they present an idea as by the idea itself. The Four Circles Schedule Process Chart fits neatly into this landscape because it bridges the gap between analytical rigor and aesthetic accessibility. It allows data to breathe without sacrificing substance.
This trend also aligns with the rise of dashboard thinking—the expectation that complex information should be scannable within seconds. Executives reviewing board decks, clients evaluating proposals, and teams tracking sprint progress all benefit from a chart that tells the whole story without requiring a deep dive into footnotes. The four-circle format delivers exactly that: a bounded, intuitive snapshot of a process in motion.
The Intersection of Time Tracking and Diagram Construction
One of the most practical applications of the Four Circles Schedule Process Chart lies at the intersection of time tracking and diagram construction. Traditional time tracking tools—timesheets, Gantt charts, calendar blocks—serve an important function but often fail to communicate the narrative behind the hours. They show when tasks happen but not why they matter or how they connect.
By incorporating a time-based axis or sequential flow into the four-circle layout, professionals can illustrate not only scheduling but also the logic and dependencies that drive it. A consulting team preparing a client-facing operations review might use the chart to show how an eight-week implementation plan breaks into four two-week phases, each represented by a circle containing key deliverables, responsible parties, and progress indicators. The visual result is both a schedule and a strategic summary—two layers of communication in one compact graphic.
Diagram construction itself is evolving. The days of static, single-purpose diagrams are fading. Modern professionals need graphics that can be repurposed across slide decks, reports, email updates, and social media snippets. The Four Circles Schedule Process Chart excels here because its proportional, balanced structure adapts well to different formats without losing legibility. It holds its shape whether scaled to a full slide or cropped for a thumbnail preview.
Infographics, Templates, and the Rise of Design-Conscious Workflows
The line between business documentation and creative design has blurred. Infographics have moved from being a specialized output of design agencies to a standard expectation in corporate environments. Templates built around the Four Circles Schedule Process Chart are increasingly common in presentation software, report builders, and online design platforms because they offer a reliable framework that non-designers can populate with confidence.
This democratization of design matters. Not every team has access to a dedicated graphic designer. Yet every team needs to communicate process, schedule, and strategy clearly. A well-constructed template built on the four-circle model gives teams a starting point that already addresses spacing, alignment, and visual hierarchy. The user simply fills in the content, adjusts colors to match brand guidelines, and achieves a polished result without starting from scratch.
Consider a marketing team planning a product launch. They might use a Four Circles Schedule Process Chart to map the pre-launch, launch day, post-launch amplification, and sustain phases. Each circle contains specific activities, KPIs, and deadlines. The resulting graphic becomes not just a planning tool but a communication asset shared with stakeholders, creative partners, and executive sponsors. It aligns everyone around a shared visual model of how the work unfolds over time.
Connecting to Broader Workplace and Technology Trends
The relevance of the Four Circles Schedule Process Chart extends into several concurrent shifts in the professional landscape:
Hybrid and Asynchronous Work
As teams distribute across locations and time zones, asynchronous communication has become the default. Written updates and recorded presentations must carry more weight because live discussion is less frequent. Visual process charts that stand on their own—without requiring a presenter to talk through them—have become essential. The four-circle layout, with its clear spatial logic and self-contained structure, translates well to asynchronous consumption. A team member reviewing the chart at 10 p.m. in a different time zone should understand the process just as clearly as someone viewing it during a live meeting.
Lean and Agile Thinking
Methodologies like Scrum, Kanban, and Lean emphasize transparency, iteration, and visual management. While the Four Circles Schedule Process Chart is not a direct replacement for a Kanban board, it complements these approaches by offering a high-level synthesis. After a sprint planning session, a four-circle chart can summarize the four key outcomes the team is working toward over the coming cycle. It provides stakeholders with a view that is simultaneously strategic and chronological—bridging the gap between detailed task tracking and executive-level reporting.
Data Storytelling and Narrative Design
Data storytelling has matured from a niche concept into a core business competency. Analysts, product managers, and strategists are increasingly expected to craft narratives around numbers. The Four Circles Schedule Process Chart supports this by providing a narrative-ready structure. The four circles can represent a beginning, a complication, a resolution, and an outcome—or any other story arc that maps to a business process. This narrative quality elevates the chart beyond mere scheduling into the realm of persuasive communication.
Practical Observations from Real-World Scenarios
In practice, professionals who adopt the Four Circles Schedule Process Chart often report an unexpected benefit: the constraint of four elements forces prioritization. When a team knows they must distill a quarterly plan into exactly four circles, conversations shift from listing every possible activity to identifying what genuinely drives progress. The chart becomes a tool for strategic clarity, not just visual presentation.
A freelance consultant preparing a proposal might use the chart to outline a four-phase engagement: discovery, strategy development, execution support, and review. Each phase occupies a circle, with estimated timelines and deliverables noted inside. The prospective client sees immediately that the consultant has a structured approach and a clear schedule. The visual nature of the proposal sets it apart from competitors submitting text-heavy documents, and the consultant wins not because they offer more detail, but because they offer more clarity.
Similarly, an internal HR team rolling out a new performance review process might use the chart to explain the annual cycle. The four circles could represent goal-setting, mid-year check-in, year-end evaluation, and development planning. Employees see at a glance when each phase occurs, what it involves, and how the pieces connect. Adoption of the new process improves because people understand it more quickly.
Future Relevance and the Growing Emphasis on Visual Literacy
As generative AI and automation tools handle an increasing share of routine analytical work, human professionals are shifting toward roles that emphasize synthesis, interpretation, and communication. The ability to translate complex ideas into clear visual formats is becoming a defining skill. Tools like the Four Circles Schedule Process Chart are not just templates—they are expressions of visual literacy, a competency that will only grow in importance.
Organizations are also recognizing that internal communication suffers when information is trapped in dense documents that few people read. Visual summaries built around process charts improve engagement and retention. The four-circle format, with its balance of structure and simplicity, is uniquely suited to this need. It invites curiosity rather than triggering avoidance, which is a significant advantage in information-heavy environments.
Furthermore, the chart's adaptability across cultural and linguistic boundaries should not be underestimated. Global teams benefit from visual communication tools that reduce language barriers. A well-designed process chart speaks a more universal visual language, and the four-circle structure is intuitive enough that it requires minimal explanation regardless of the viewer's native language or cultural background.
Bringing It All Together
The Four Circles Schedule Process Chart is more than a diagram type. It represents a philosophy of communication that values clarity over complexity, structure over sprawl, and visual impact over verbal density. In a business environment that increasingly rewards those who can make sense of complexity and share that understanding with others, adopting such tools is a practical step toward more effective work.
Whether you are crafting an investor deck, organizing a team workshop, designing a client-facing report, or simply trying to make sense of your own quarterly priorities, the four-circle approach offers a tested framework. It asks you to think in phases, to connect time with outcome, and to present your thinking in a way that others can absorb, remember, and act upon. That combination—of analytical depth and communicative clarity—is rare and valuable, and it explains why this humble chart continues to gain attention among professionals who take their presentations and planning seriously.