Clarifying Complex Workflows Using the Eight Pointers and Earth Map Process Chart
Most business processes fall apart not because the idea is weak, but because the communication around it creates confusion. A strategy document filled with bullet points can leave a room full of stakeholders with eight different interpretations. This is exactly where the Eight Pointers and Earth Map Process Chart earns its place in your toolkit. It takes abstract sequences, multi-layered planning, and geographic or departmental relationships and gives them a visual anchor that people can actually follow.
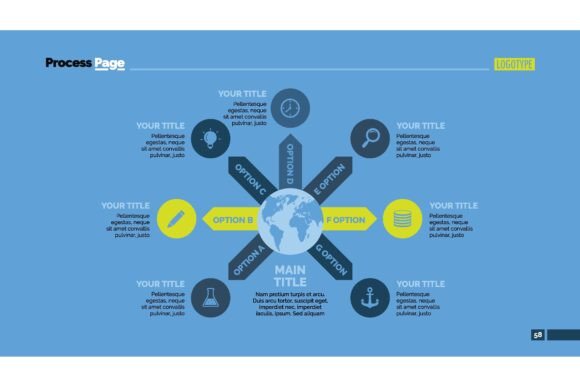
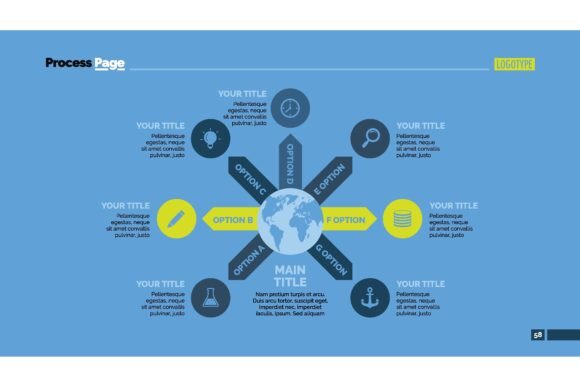
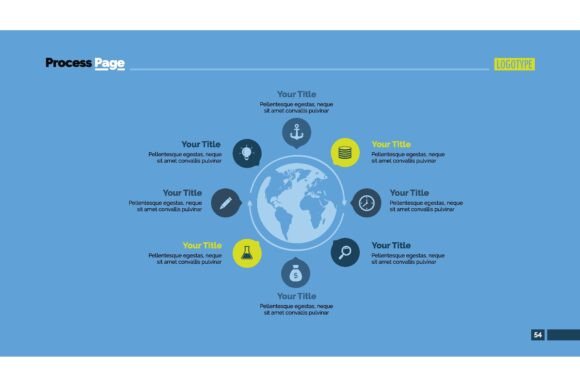
Rather than treating data as static numbers or isolated milestones, this graphic set wraps information into a globe-spanning visual metaphor that simultaneously shows detail and context. The eight pointer elements radiate outward, each carrying a distinct phase, principle, or data point, while the earth map at the center grounds the entire composition. The result is a narrative device that works across training decks, investor updates, project kickoffs, and internal process documentation.
What the Eight Pointers and Earth Map Process Chart Actually Represents
At its core, this chart is a radial information structure. Eight connectors orbit a central map graphic, each capable of holding its own label, icon, and descriptive text. The earth map element isn't decorative filler. It serves as a universal reference point — whether you're illustrating global market penetration, regional team distribution, supply chain nodes, or phased rollout plans across territories.
Think of it as a hybrid between a traditional process flow and a geographic heat map. You're not choosing between showing sequence and showing location. The layout lets you do both simultaneously. A training manager might place learning objectives on the pointers while using the map to highlight where each training module is being piloted. A product manager could map user journey stages against regional adoption data. The structure adapts to the story you need to tell, not the other way around.
Where This Chart Fits Into Real Workflows
The practical value of any visual tool lies in how naturally it slides into the work you're already doing. The Eight Pointers and Earth Map Process Chart bridges several workflow gaps that often trip up teams.
Before a Project Launches
Pre-project alignment is notoriously difficult. You have research findings, stakeholder expectations, initial scope documents, and risk assessments scattered across emails and shared drives. Using this chart early shifts the conversation from "here's a pile of information" to "here's how the pieces connect." Map your eight foundational pillars — maybe market research, resource allocation, timeline milestones, compliance requirements, technology dependencies, team roles, budget parameters, and success metrics — each to a pointer. The central map can show where the initiative will deploy first or which regions are contributing data to the planning phase.
This approach does something important: it forces clarity before execution begins. When you have to distill a complex initiative into eight clear nodes arranged around a geographic core, you quickly discover which assumptions haven't been validated and which connections haven't been made explicit.
During Active Execution
Once a project is moving, the chart shifts from planning tool to tracking dashboard substitute. Each pointer can represent a workstream's current status, with the map reflecting real-time geographic progress. A marketing director running a multi-country campaign might update the eight pointers weekly — content localization, paid media performance, organic reach, event attendance, partner engagement, lead conversion, social sentiment, and budget burn rate. The map underneath visually reinforces where attention is concentrated and where gaps are opening.
This isn't a substitute for detailed project management software. It's a communication layer that sits on top of your actual tracking tools. You pull the summary insights from Asana, Monday, Jira, or your spreadsheets and translate them into a visual that leadership can absorb in under a minute.
After Completion and During Review
Post-mortems and retrospective sessions benefit enormously from spatial visualization. Instead of reading through a linear report, stakeholders can see the full picture at once. Which regions overperformed? Where did bottlenecks cluster? The earth map element makes regional performance comparisons intuitive. The eight pointers can capture lessons learned, recommendations, or quantitative outcomes that feed directly into the next planning cycle.
Practical Integration With Other Tools and Methods
The Eight Pointers and Earth Map Process Chart doesn't exist in isolation. It works best when woven into a broader ecosystem of planning methods and communication tools. Here are several integration patterns that reflect how professionals actually work.
With SWOT Analysis: Place the four SWOT categories across eight pointers by splitting each into internal and external dimensions. Strengths (internal capabilities, external reputation), Weaknesses (internal gaps, external vulnerabilities), Opportunities (internal innovations, external market shifts), Threats (internal resource constraints, external competitive pressure). The map highlights where these factors are most relevant geographically.
With OKR Frameworks: Use the eight pointers for your key results, radiating around objectives anchored to regional or departmental maps. This gives leadership a single-slide view of how company-wide goals translate across the organization's footprint.
With Agile Ceremonies: Sprint reviews, quarterly planning, and PI planning events all involve synthesizing large amounts of information for diverse audiences. Replace dense bullet-point slides with this chart to show how eight sprint goals or eight feature sets map to user locations or deployment regions.
With Stakeholder Decks: Board presentations and investor updates demand clarity under time pressure. The earth map provides immediate orientation, while the eight pointers deliver the key data points without overwhelming the audience with text-heavy slides.
Getting the Most From the Design Structure
Working with this chart effectively means respecting its design logic while adapting it to your specific context. A few practical considerations make the difference between a slide that lands and one that confuses.
Label Discipline
Each of the eight pointers has limited space for text. This is a feature, not a bug. Short, action-oriented labels work best. Instead of "Analysis of Customer Feedback Data From Q3 Surveys Across European Markets," write "Q3 European Customer Insights." The supporting text field can carry the nuance. The label grabs attention and establishes the category. Train yourself to edit ruthlessly here.
Consistent Visual Weight
When all eight pointers carry roughly the same level of detail, the chart feels balanced and professional. If one pointer contains a dense paragraph while others have single words, the visual hierarchy breaks. Aim for structural consistency across all eight nodes. If you're describing processes, make each pointer a complete phase. If you're presenting metrics, give each one a comparable data format.
Map Relevance
The earth map at the center should always earn its place. If your project has zero geographic dimension, consider whether a different central element would serve better. But most business processes do have geographic aspects worth surfacing — customer locations, team distribution, supply chain routes, regulatory zones, language regions, or market segments. Be explicit about what the map is showing. A legend or brief caption prevents misinterpretation.
Use Cases Across Different Roles
The versatility of the Eight Pointers and Earth Map Process Chart becomes clear when you examine how different professionals deploy it.
Corporate Trainers and Educators: Structure an eight-module curriculum around the pointers, with the map showing where learners are accessing materials or where in-person sessions are scheduled. This helps administrators allocate resources and helps learners see their place in a broader learning community.
Entrepreneurs and Small Business Owners: When pitching to investors or aligning a small team, use the chart to show how eight core business functions — product development, sales, marketing, customer support, finance, operations, partnerships, and talent — connect across target markets. The earth map reinforces ambition and reach without requiring a separate slide for every territory.
Freelancers and Independent Creators: Client proposals become more compelling when you can visually demonstrate your process. Map your eight-step creative workflow against client markets or content distribution channels. This signals professionalism and structured thinking, which often justifies premium pricing.
Publishers and Content Strategists: Editorial calendars, content pillars, and distribution strategies all map naturally to this format. Eight content themes around a map of audience geography creates an instant visual strategy document that editorial teams and advertisers can both understand.
Quality Control and Long-Term Consistency
A visual asset like this only maintains its value if you use it consistently over time. Create a template version with your brand colors, fonts, and standard label formats. Save it in your presentation library so that every department pulls from the same source. When teams improvise their own versions, the visual language fragments and audiences lose the familiarity that makes the chart instantly readable.
Review the chart before any major presentation. Check that the map data is current, the pointer labels reflect the latest terminology, and the overall composition hasn't become cluttered through iterative edits. A quick quality pass prevents the slow drift into visual noise that undermines clarity.
Making the Chart Part of Your Communication Rhythm
The highest-value tools are the ones you reach for repeatedly without overthinking. Start by identifying one recurring communication need where dense information currently lives in unattractive, hard-to-process formats. A monthly business review, a quarterly strategy update, or a client onboarding packet are good candidates. Replace the existing slide or section with the eight pointers and earth map layout. Run it for two or three cycles, gathering feedback from your audience. Adjust the categories, labels, and map emphasis based on what people actually find useful.
Over time, your colleagues and stakeholders will begin to expect this visual language. That expectation is valuable. It means you've built a shared framework for discussing complex topics, and that framework saves everyone time and mental energy.
Adapting the Chart as Needs Evolve
No process chart remains perfectly aligned with reality forever. Markets shift, teams reorganize, strategies pivot. Revisit the structure of your eight pointers periodically. Are all eight still relevant? Has a new category emerged that deserves a slot? The framework should serve the work, not constrain it. The underlying design of the chart supports this adaptability — the pointers and map can be re-labeled, recolored, and re-prioritized without losing the core visual logic.
The Eight Pointers and Earth Map Process Chart ultimately functions as a thinking tool as much as a presentation asset. The act of fitting your information into this structure forces you to prioritize, categorize, and spatialize your ideas. That mental exercise alone improves the quality of your planning before you ever show the slide to anyone else. The visual result is the outward expression of clearer thinking, and that's what makes presentations genuinely compelling.